Usually, SNMP is used to pool network devices. SNMP especially the walk function is very CPU intensive and is often unsecured by using SNMPv1 or SNMPv2.
Telemetry can help you to monitor your devices and not only the CPU/Memory or interface (in/out) counter. You can also monitor CRC, Optic budget, etc easily.
We will use Grafana with InfluxDB and Telegraf.
On Cisco Nexus device you need to enable the feature telemetry.
feature telemetry
Then you need to configure three others parts:
- A destination group, where is located your NMS tool
- A sensor Group, which contains what you want to stream to your NMS tool
- A subscription, which associates the destination group and the sensor group.
telemetry
  destination-group 1
    ip address 10.202.2.100 port 57000 protocol gRPC encoding GPB
    use-vrf management
  sensor-group 101
    data-source NX-API
    path "show system resources" depth 0
  sensor-group 102
    data-source NX-API
    path "show interface transceiver detail"
  sensor-group 103
    data-source NX-API
    path "show interface"
    path "show interface e1/2"
  subscription 101
    dst-grp 1
    snsr-grp 101 sample-interval 10000
  subscription 102
    dst-grp 1
    snsr-grp 102 sample-interval 60000
  subscription 103
    dst-grp 1
    snsr-grp 103 sample-interval 10000
In the previous example, we can see one destination group to stream the data to the server 10.202.2.100 port 57000/tcp. We use gRPC with GPB to send the flow.
The server 10.202.2.100 is a docker server, which runs Grafana with influxDB and telegraf.
# docker ps
CONTAINER ID        IMAGE                                   COMMAND                  CREATED             STATUS              PORTS                                                    NAMES
0ea44fcb6359        telegraf                                "/entrypoint.sh tele…"   5 days ago          Up 5 days           8092/udp, 8125/udp, 8094/tcp, 0.0.0.0:57000->57000/tcp   telemetry_telegraf_1
37001630a9aa        grafana/grafana:latest                  "/run.sh"                5 days ago          Up 5 days           0.0.0.0:3000->3000/tcp                                   telemetry_grafana_1
db99097a276f        influxdb:latest                         "/entrypoint.sh infl…"   5 days ago          Up 5 days           0.0.0.0:8086->8086/tcp                                   telemetry_influxdb_1
You can run this stack with the following docker-compose file.
To start the stack enters the command docker-compose up -d
# cat docker-compose.yml
version: '3'
services:
  grafana:
    #restart: always
    image: grafana/grafana:latest
    ports:
     - "3000:3000"
    tty: true
    privileged: true
  influxdb:
    image: influxdb:latest
    ports:
      - '8086:8086'
    environment:
      - INFLUXDB_DB=db0
  telegraf:
    image: telegraf
    ports:
      - '57000:57000'
    #restart: always
On the telegraf configuration, we just specify where is the influx database and what we used to receive the flow from the Nexus devices.
[global_tags]

[agent]
  interval = "10s"
  round_interval = true
  metric_batch_size = 1000
  metric_buffer_limit = 10000
  collection_jitter = "0s"

  flush_interval = "10s"
  flush_jitter = "0s"

  precision = ""

  hostname = ""
  omit_hostname = false

[..]

[[outputs.influxdb]]
  urls = ["http://influxdb:8086"]
  database = "db0"

[[inputs.cisco_telemetry_mdt]]
transport = "grpc"
service_address = ":57000"
 [inputs.cisco_telemetry_mdt.aliases]
    ifstats = "ietf-interfaces:interfaces-state/interface/statistics"
The data source on Grafana:
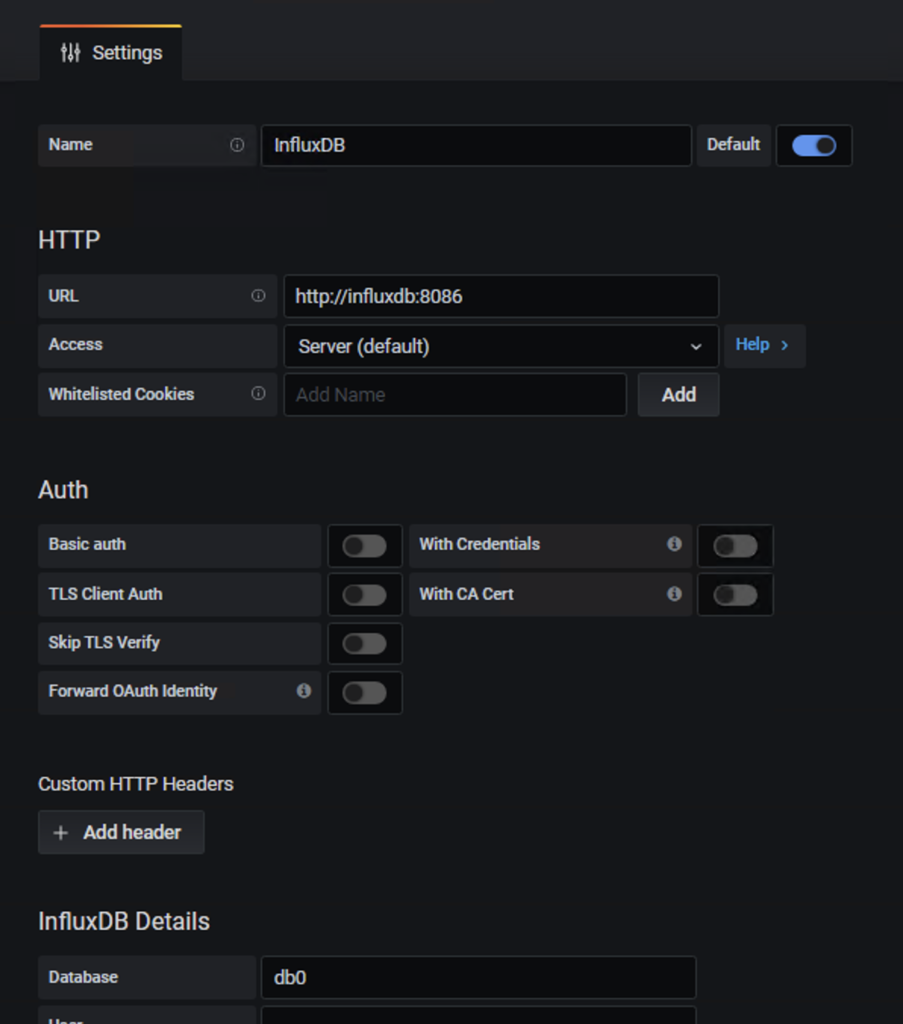
Now, you should received data to your influxdb via your pipeline telegraf. This is the moment to create a dashboard.
The following example will show how to monitor your optical budget.
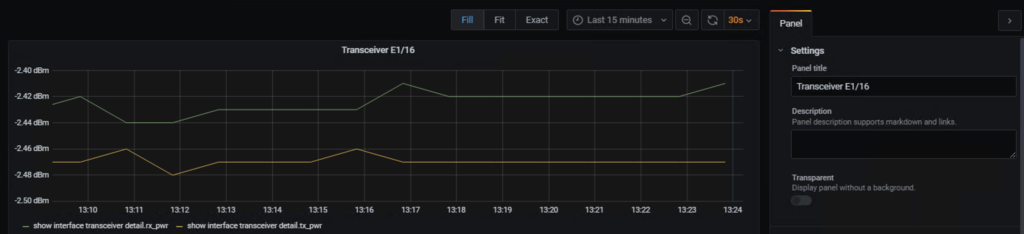
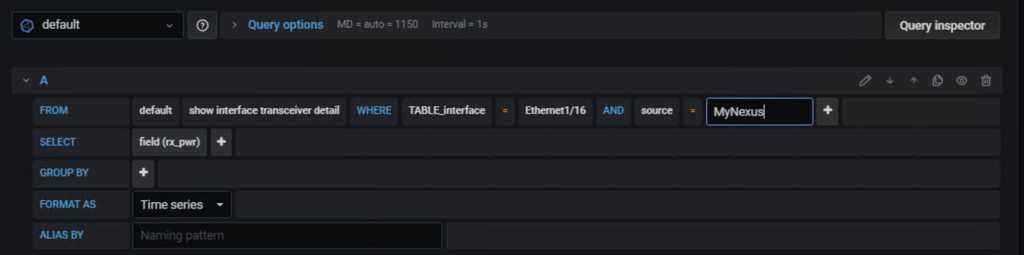
Now you need to create you request to get the value. In this example we want to use the stream with the command “show interface transceiver detail” and select one specific interface (Ethernet 1/16). We can use the parameter Where Table_interface to get all interfaces and select the good one. Finally if you have a lot of Nexus devices you can add a source. The latest part is to select which value you want. Here we get rx_pwr.
If you need to have the detail before. You can enter the following command on your Cisco Nexus device.
# show interface e1/16 transceiver details | json-pretty
{
    "TABLE_interface": {
        "ROW_interface": {
            "interface": "Ethernet1/16",
            "sfp": "present",
            "type": "Fabric Extender Transceiver",
            "name": "CISCO-FINISAR",
            "partnum": "FTLX8570D3BCL-C2",
            "rev": "A",
            "serialnum": "FNxxxxxxx",
            "nom_bitrate": "10300",
            "len_625": "10",
            "len_50_OM3": "100",
            "ciscoid": "3",
            "ciscoid_1": "4",
            "cisco_part_number": "10-2566-02",
            "cisco_product_id": "FET-10G",
            "cisco_vendor_id": "V02",
            "TABLE_lane": {
                "ROW_lane": {
                    "temperature": "36.36",
                    "temp_flag": null,
                    "temp_alrm_hi": "75.00",
                    "temp_alrm_lo": "5.00",
                    "temp_warn_hi": "70.00",
                    "temp_warn_lo": "10.00",
                    "voltage": "3.26",
                    "volt_flag": null,
                    "volt_alrm_hi": "3.63",
                    "volt_alrm_lo": "2.97",
                    "volt_warn_hi": "3.46",
                    "volt_warn_lo": "3.13",
                    "current": "7.89",
                    "current_flag": null,
                    "current_alrm_hi": "11.80",
                    "current_alrm_lo": "4.00",
                    "current_warn_hi": "10.80",
                    "current_warn_lo": "5.00",
                    "tx_pwr": "-2.47",
                    "tx_pwr_flag": null,
                    "tx_pwr_alrm_hi": "2.69",
                    "tx_pwr_alrm_lo": "-11.30",
                    "tx_pwr_warn_hi": "-1.30",
                    "tx_pwr_warn_lo": "-7.30",
                    "rx_pwr": "-2.42",
                    "rx_pwr_flag": null,
                    "rx_pwr_alrm_hi": "2.99",
                    "rx_pwr_alrm_lo": "-13.97",
                    "rx_pwr_warn_hi": "-1.00",
                    "rx_pwr_warn_lo": "-9.91",
                    "xmit_faults": "0"
                }
            }
        }
    }
}
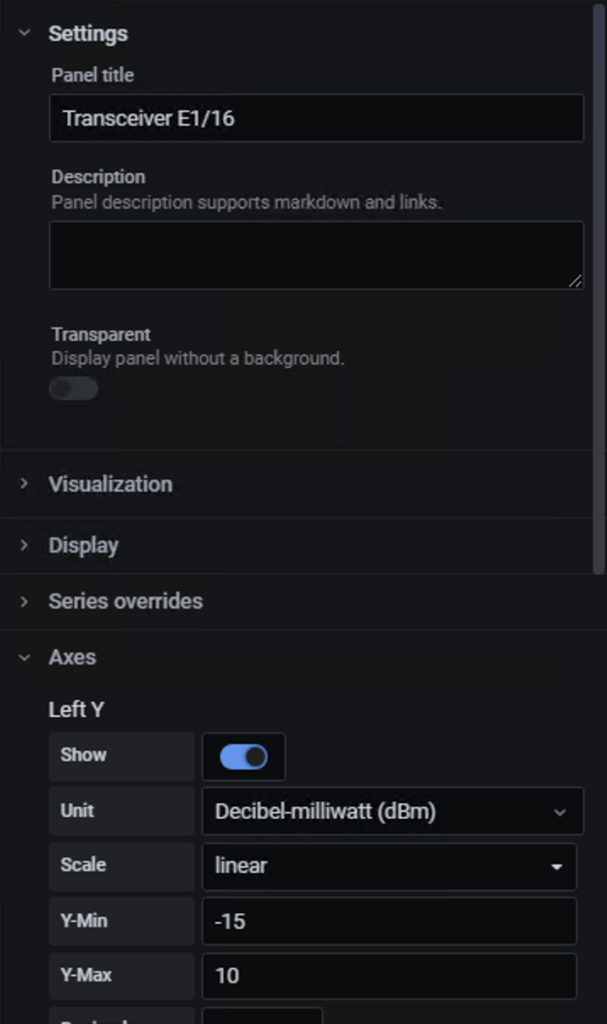
You can change the title and the units.
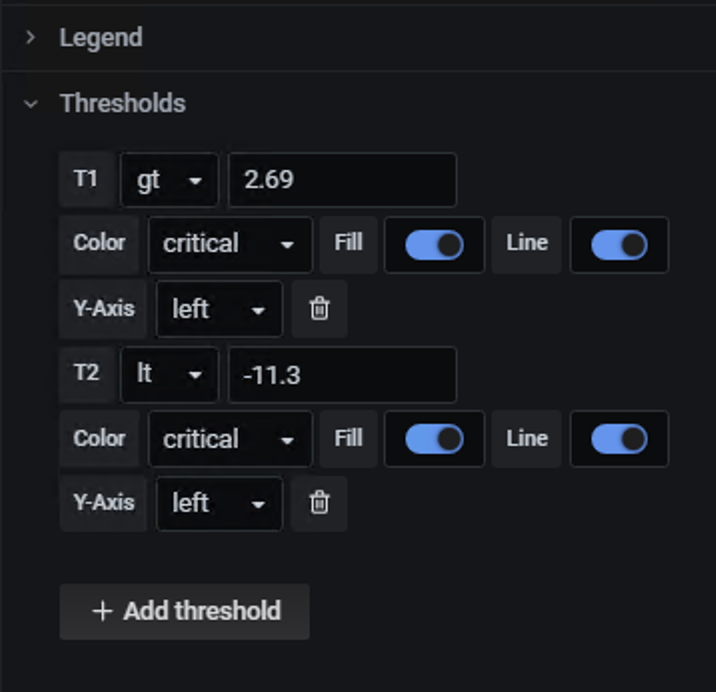
You can also define thresholds.
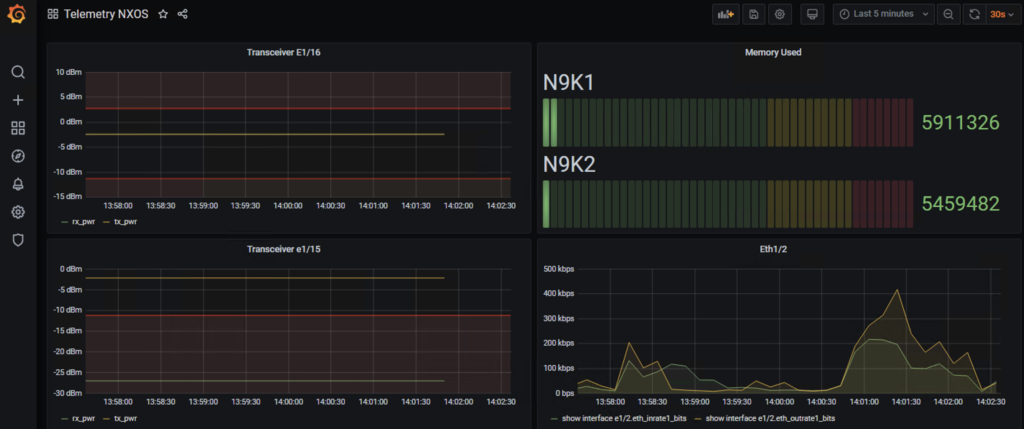
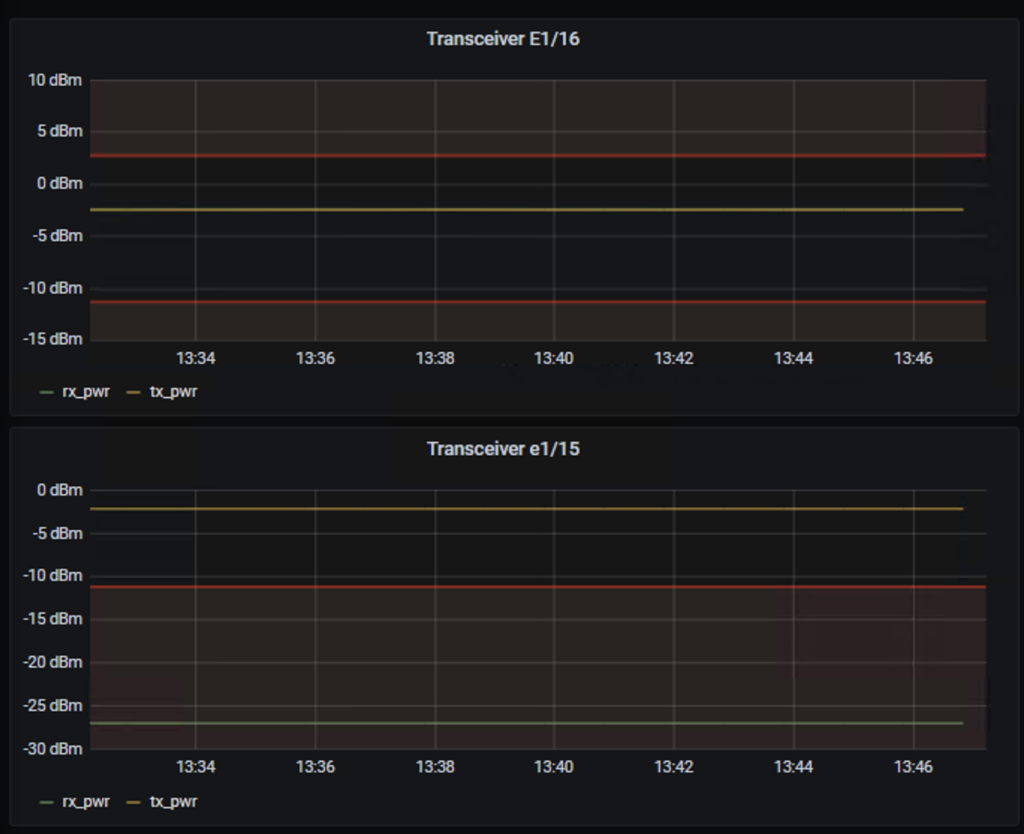
The following picture will show you two cases. The Ethernet E1/15 which has an issue in Rx and the Ethernet E1/16 where the values are good.
In CLI :
N9K1# show interface e1/15 transceiver details
Ethernet1/15
    transceiver is present
    type is Fabric Extender Transceiver
    name is CISCO-JDSU
    part number is PLRXPL-VC-S43-CG
    revision is B
    serial number is JURxxxxxxxx
    nominal bitrate is 10300 MBit/sec
    Link length supported for 62.5/125um fiber is 10 m
    Link length supported for 50/125um OM3 fiber is 100 m
    cisco id is 3
    cisco extended id number is 4
    cisco part number is 10-2566-02
    cisco product id is FET-10G
    cisco version id is V02

           SFP Detail Diagnostics Information (internal calibration)
  ----------------------------------------------------------------------------
                Current              Alarms                  Warnings
                Measurement     High        Low         High          Low
  ----------------------------------------------------------------------------
  Temperature   37.33 C        75.00 C      5.00 C     70.00 C       10.00 C
  Voltage        3.26 V         3.63 V      2.97 V      3.46 V        3.13 V
  Current        4.80 mA       10.00 mA     2.59 mA     8.50 mA       3.00 mA
  Tx Power      -2.21 dBm       2.69 dBm  -11.30 dBm   -1.30 dBm     -7.30 dBm
  Rx Power     -26.98 dBm --    2.99 dBm  -13.97 dBm   -1.00 dBm     -9.91 dBm
  Transmit Fault Count = 0
  ----------------------------------------------------------------------------
  Note: ++  high-alarm; +  high-warning; --  low-alarm; -  low-warning

N9K1# show interface e1/16 transceiver details
Ethernet1/16
    transceiver is present
    type is Fabric Extender Transceiver
    name is CISCO-FINISAR
    part number is FTLX8570D3BCL-C2
    revision is A
    serial number is FNxxxxxxYS
    nominal bitrate is 10300 MBit/sec
    Link length supported for 62.5/125um fiber is 10 m
    Link length supported for 50/125um OM3 fiber is 100 m
    cisco id is 3
    cisco extended id number is 4
    cisco part number is 10-2566-02
    cisco product id is FET-10G
    cisco version id is V02

           SFP Detail Diagnostics Information (internal calibration)
  ----------------------------------------------------------------------------
                Current              Alarms                  Warnings
                Measurement     High        Low         High          Low
  ----------------------------------------------------------------------------
  Temperature   36.03 C        75.00 C      5.00 C     70.00 C       10.00 C
  Voltage        3.27 V         3.63 V      2.97 V      3.46 V        3.13 V
  Current        7.89 mA       11.80 mA     4.00 mA    10.80 mA       5.00 mA
  Tx Power      -2.44 dBm       2.69 dBm  -11.30 dBm   -1.30 dBm     -7.30 dBm
  Rx Power      -2.41 dBm       2.99 dBm  -13.97 dBm   -1.00 dBm     -9.91 dBm
  Transmit Fault Count = 0
  ----------------------------------------------------------------------------
  Note: ++  high-alarm; +  high-warning; --  low-alarm; -  low-warning
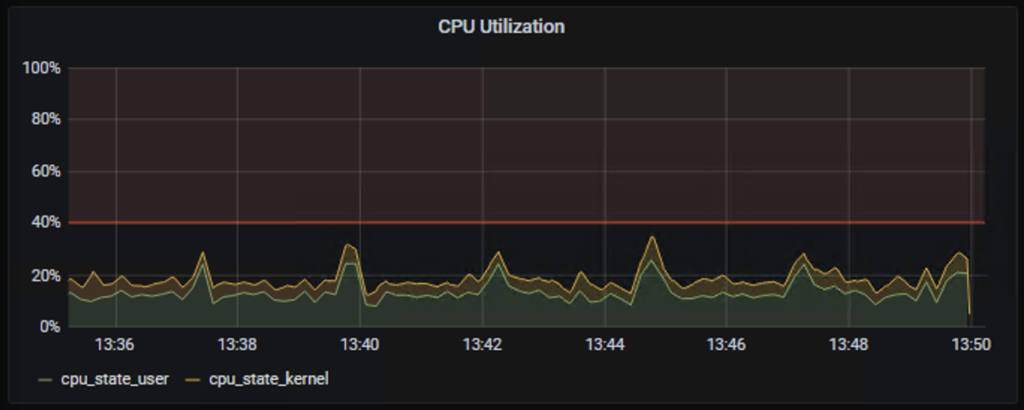
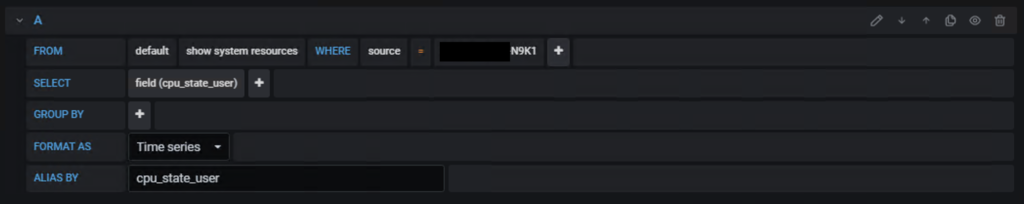
Other example to monitor the CPU with the sensor group: show system resources.