Start a new DevOps journey with Docker and automate ACI

If you want to test the automation with Cisco ACI, you can use the following container.

docker pull zednetwork/aci-dev:latest

root@docker1:~/aci-dev# docker images zednetwork/aci-dev
REPOSITORY           TAG                 IMAGE ID            CREATED             SIZE
zednetwork/aci-dev   latest              b1c09a7c66f0        About an hour ago   1.31GB

I preinstalled Ansible 2.9.11, the ACI SDK (COBRA) in version 4.2(4) and ARYA.

You can run directly the container with the command:

docker run -it <Image ID> bash

or start it with docker-compose command :

docker-compose up -d 

Docker-compose file :

---
version: "3"

services:
  aci-dev:
    image: zednetwork/aci-dev:latest
    stdin_open: true

and connect to the container :

root@docker1:~/aci-dev# docker-compose ps
      Name          Command   State   Ports
-------------------------------------------
aci-dev_aci-dev_1   bash      Up

root@docker1:~/aci-dev# docker exec -it  aci-dev_aci-dev_1 bash

Packages version

root@3a93719ed29b:~# ansible --version
/usr/local/lib/python2.7/dist-packages/cryptography/__init__.py:39: CryptographyDeprecationWarning: Python 2 is no longer supported by the Python core team. Support for it is now deprecated in cryptography, and will be removed in a future release.
  CryptographyDeprecationWarning,
ansible 2.9.11
  config file = None
  configured module search path = [u'/root/.ansible/plugins/modules', u'/usr/share/ansible/plugins/modules']
  ansible python module location = /usr/local/lib/python2.7/dist-packages/ansible
  executable location = /usr/local/bin/ansible
  python version = 2.7.16 (default, Oct 10 2019, 22:02:15) [GCC 8.3.0]
root@3a93719ed29b:~# pip list
Package      Version
------------ ---------
acicobra     4.2-4i
acimodel     4.2-4i
ansible      2.9.11
arya         1.1.5
certifi      2020.6.20
cffi         1.14.1
chardet      3.0.4
cryptography 3.0
enum34       1.1.10
et-xmlfile   1.0.1
future       0.18.2
idna         2.10
ipaddress    1.0.23
jdcal        1.4.1
Jinja2       2.11.2
MarkupSafe   1.1.1
openpyxl     2.6.4
pip          18.1
ply          3.11
prettytable  0.7.2
pyaml        20.4.0
pycparser    2.20
PyYAML       5.3.1
requests     2.24.0
setuptools   44.1.1
six          1.15.0
urllib3      1.25.10

Then you can copy and paste one script and runs it.

Example with the script (https://zed-network.fr/?p=511) :

root@40a189762958:~/cobra# pwd
/root/cobra

root@40a189762958:~/cobra# ls
getEP.py

root@40a189762958:~/cobra# python getEP.py
MAC: FA:16:3E:9A:35:B7 | IP: 10.0.0.1 | Encaps: vlan-489
MAC: FA:16:3E:BB:B4:BE | IP: 42.0.0.1 | Encaps: vlan-488
[..]

How to Gather your Endpoints with COBRA on ACI

Gather EPs

The following script will help to gather all Endpoints easily with the python ACI sdk : COBRA.

This script will send an REST API request and return the Endpoints (MAC, IP and vlan encaps)

(cobra) root@341ad8347e20:~# cat getEps.py
from cobra.mit.access import MoDirectory
from cobra.mit.session import LoginSession
from cobra.mit.request import ConfigRequest
from cobra.mit.access import ClassQuery

import urllib3
urllib3.disable_warnings()

uri = 'https://[APIC]:[Port]'
user = 'admin'
pw = 'cisco01234'

ls = LoginSession(uri, user, pw)
md = MoDirectory(ls)
md.login()
# Use the connected moDir queries and configuration...

cq = ClassQuery('fvCEp')
cq.subtitle = 'full'
objlist = md.query(cq)

for mo in objlist:
    print "MAC: " + mo.mac + " | " + "IP: " + mo.ip + " | " + "Encaps: " + mo.encap

md.logout()

(cobra) root@341ad8347e20:~# python getEps.py
[..]
MAC: 00:50:56:B6:96:06 | IP: 10.2.80.67 | Encaps: vlan-3967
MAC: 00:50:56:B6:E2:41 | IP: 10.2.80.71 | Encaps: vlan-3967
MAC: 00:50:56:B6:AA:2A | IP: 10.2.80.73 | Encaps: vlan-3967
[..]

How to automate Cisco UCS with Ansible playbook

To use ansible with Cisco UCS Manager, you need to install the SDK on your ansible server.

root@c86d023821ff:~# pip install ucsmsdk
Collecting ucsmsdk
Downloading https://files.pythonhosted.org/packages/f7/f9/280d7cea9e37ed183d694f5d2e8505b5eacfdbad709eba68fc32a5ed2bcf/ucsmsdk-0.9.10.tar.gz (4.2MB)
100% |################################| 4.2MB 306kB/s
Collecting pyparsing (from ucsmsdk)
Downloading https://files.pythonhosted.org/packages/8a/bb/488841f56197b13700afd5658fc279a2025a39e22449b7cf29864669b15d/pyparsing-2.4.7-py2.py3-none-any.whl (67kB)
100% |################################| 71kB 5.2MB/s
Requirement already satisfied: setuptools in /usr/lib/python2.7/dist-packages (from ucsmsdk) (40.8.0)
Requirement already satisfied: six in /usr/lib/python2.7/dist-packages (from ucsmsdk) (1.12.0)
Building wheels for collected packages: ucsmsdk
Running setup.py bdist_wheel for ucsmsdk … done
Stored in directory: /root/.cache/pip/wheels/ac/a2/a9/5c39875aca61b780d8d94690f22b54237452d9fc290756781f
Successfully built ucsmsdk
Installing collected packages: pyparsing, ucsmsdk
Successfully installed pyparsing-2.4.7 ucsmsdk-0.9.10

root@c86d023821ff:~# pip list | grep ucs
ucsmsdk 0.9.10

Then you can create a simple inventory file with the UCS Manager IP.

Example:

root@c86d023821ff:~# cat inv_ucs
[ucs]
10.0.100.162

Then you can create a simple playbook to add one vlan:

root@c86d023821ff:~# cat ucs_vlan.yml
---
- name: ENSURE APPLICATION CONFIGURATION EXISTS
  hosts: ucs
  connection: local
  gather_facts: False

  tasks:

  - name: Configure VLAN
    ucs_vlans:
      hostname: 10.0.100.162
      username: ucspe
      password: ucspe
      name: TheVlan11
      id: '11'
      native: 'no'

And finally you can run it:

root@c86d023821ff:~# ansible-playbook ucs_vlan.yml -i inv_ucs
PLAY [ENSURE APPLICATION CONFIGURATION EXISTS] *
TASK [Configure VLAN] **
[WARNING]: Platform linux on host 10.0.100.162 is using the discovered Python interpreter at /usr/bin/python, but
future installation of another Python interpreter could change this. See
https://docs.ansible.com/ansible/2.9/reference_appendices/interpreter_discovery.html for more information.
changed: [10.0.100.162]
PLAY RECAP *
10.0.100.162 : ok=1 changed=1 unreachable=0 failed=0 skipped=0 rescued=0 ignored=0

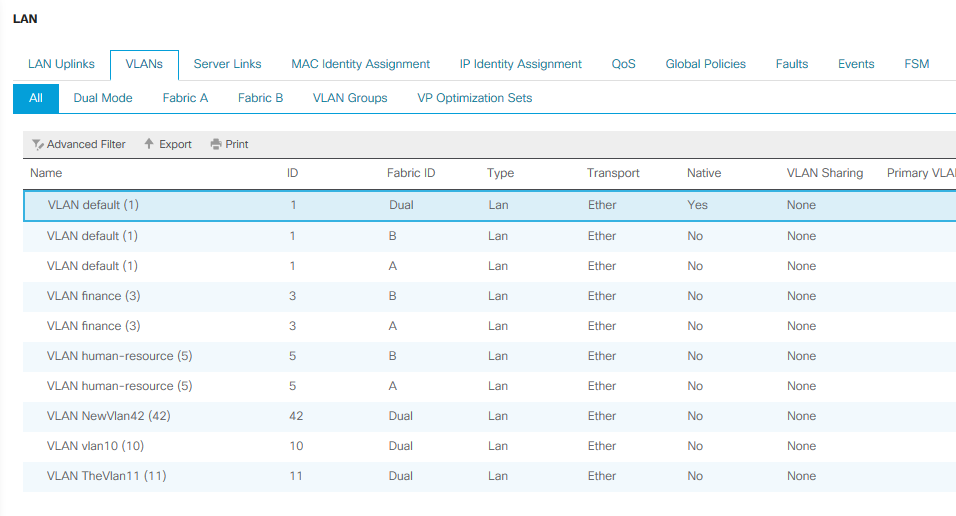
Now your vlan ID 11 is available on the UCS Fabric Interconnect.

You can use the module ansible ucs_vlan_find to get all vlans:

root@c86d023821ff:~# cat ucs_vlan.yml
---
- name: ENSURE APPLICATION CONFIGURATION EXISTS
  hosts: ucs
  connection: local
  gather_facts: False

  tasks:

  - name: Get All Vlans
    ucs_vlan_find:
      hostname: 10.0.100.162
      username: ucspe
      password: ucspe
      pattern: '.'
    register: vlans
    tags:
    - showvlan

  - name: Display vlans
    debug:
      var: vlans
    tags:
    - showvlan

Result:

root@c86d023821ff:~# ansible-playbook ucs_vlan.yml -i inv_ucs --tags showvlan
PLAY [ENSURE APPLICATION CONFIGURATION EXISTS]
TASK [Get All Vlans]
[WARNING]: Platform linux on host 10.0.100.162 is using the discovered Python interpreter at /usr/bin/python, but future installation of
another Python interpreter could change this. See https://docs.ansible.com/ansible/2.9/reference_appendices/interpreter_discovery.html for
more information.
ok: [10.0.100.162]
TASK [Display vlans]
ok: [10.0.100.162] => {
"vlans": {
"ansible_facts": {
"discovered_interpreter_python": "/usr/bin/python"
},
"changed": false,
"failed": false,
"vlan_list": [
{
"id": "1",
"name": "default"
},
{
"id": "5",
"name": "human-resource"
},
{
"id": "1",
"name": "default"
},
{
"id": "3",
"name": "finance"
},
{
"id": "5",
"name": "human-resource"
},
{
"id": "1",
"name": "default"
},
{
"id": "3",
"name": "finance"
},
{
"id": "42",
"name": "NewVlan42"
},
{
"id": "10",
"name": "vlan10"
},
{
"id": "11",
"name": "TheVlan11"
}
],
"warnings": [
"Platform linux on host 10.0.100.162 is using the discovered Python interpreter at /usr/bin/python, but future installation of another Python interpreter could change this. See https://docs.ansible.com/ansible/2.9/reference_appendices/interpreter_discovery.html for more information."
]
}
}
PLAY RECAP **
10.0.100.162 : ok=2 changed=0 unreachable=0 failed=0 skipped=0 rescued=0 ignored=0

How to automate Cisco UCS with Microsoft Powershell

To test and verify your script you can use the virtual environment UCSPE.

First install Ucs.Manager Package on Powershell.

PS C:\WINDOWS\system32> Install-Module -Name Cisco.UCSManager -RequiredVersion 2.5.3.0

Verify Module is installed.

PS C:\WINDOWS\system32> Get-Package -Name *Ucs*
Name Version Source ProviderName
---- ------- ------ ------------
Cisco.UCS.Core 2.5.3.0 https://www.powershellgallery… PowerShellGet
Cisco.UCSManager 2.5.3.0 https://www.powershellgallery… PowerShellGet

Connect to UCS Manager. A pop-up will be open to enter your login and password.

PS C:\WINDOWS\system32> Connect-Ucs 10.0.100.162
applet de commande Connect-Ucs à la position 1 du pipeline de la commande
Fournissez des valeurs pour les paramètres suivants :
Credential
NumPendingConfigs : 0
Ucs : UCSPE-10-0-100-162
Cookie : 1594713831/e2c5faea-c1d9-412f-b7d1-b582c379477a
Domains : org-root
LastUpdateTime : 14/07/2020 10:03:54
Name : 10.0.100.162
NoSsl : False
NumWatchers : 0
Port : 443
Priv : {aaa, admin, ext-lan-config, ext-lan-policy…}
PromptOnCompleteTransaction : False
Proxy :
RefreshPeriod : 600
SessionId :
TransactionInProgress : False
Uri : https://10.0.100.162
UserName : ucspe
Version : 4.0(4e)
VirtualIpv4Address : 10.0.100.162
WatchThreadStatus : None

You can also enter directly your password.

PS C:\WINDOWS\system32> $ucsm_credentials = New-Object -TypeName System.Management.Automation.PSCredential -ArgumentList "ucspe", $(ConvertTo-SecureString -AsPlainText "ucspe" -Force)
PS C:\WINDOWS\system32> $ucsm_credentials
UserName Password
-------- --------
ucspe System.Security.SecureString
PS C:\WINDOWS\system32> Connect-Ucs 10.0.100.162 -Credential $ucsm_credentials
NumPendingConfigs : 0
Ucs : UCSPE-10-0-100-162
Cookie : 1594715399/f32ff405-981f-4c7a-817a-1d09324c89b6
Domains : org-root
LastUpdateTime : 14/07/2020 10:29:59
Name : 10.0.100.162
NoSsl : False
NumWatchers : 0
Port : 443
Priv : {aaa, admin, ext-lan-config, ext-lan-policy…}
PromptOnCompleteTransaction : False
Proxy :
RefreshPeriod : 600
SessionId :
TransactionInProgress : False
Uri : https://10.0.100.162
UserName : ucspe
Version : 4.0(4e)
VirtualIpv4Address : 10.0.100.162
WatchThreadStatus : None

You can disconnect with the following command:

PS C:\WINDOWS\system32> Disconnect-Ucs
Ucs : UCSPE-10-0-100-162
InCookie : 1594715399/f32ff405-981f-4c7a-817a-1d09324c89b6
Name : 10.0.100.162
OutStatus : success
SessionId :
Uri : https://10.0.100.162
Version : 4.0(4e)

You can Get the UCS blades and servers with this command:

PS C:\WINDOWS\system32> Get-UcsServer

AdminPower : policy
AdminState : in-service
AssetTag :
AssignedToDn :
Association : none
Availability : available
AvailableMemory : 49152
ChassisId : 3
CheckPoint : discovered
ConnPath : {A, B}
ConnStatus : {A, B}
Descr :
Discovery : complete
DiscoveryStatus :
KmipFault : no
KmipFaultDescription :
Lc : undiscovered
LcTs : 1970-01-01T00:00:00.000
LocalId :
LowVoltageMemory : not-applicable
ManagingInst : A
MemorySpeed : not-applicable
MfgTime : not-applicable
Model : UCSB-EX-M4-1
Name :
NumOf40GAdaptorsWithOldFw : 0
NumOf40GAdaptorsWithUnknownFw : 0
NumOfAdaptors : 2
NumOfCores : 10
NumOfCoresEnabled : 10
NumOfCpus : 2
NumOfEthHostIfs : 0
NumOfFcHostIfs : 0
NumOfThreads : 16
OperPower : off
OperPwrTransSrc : unknown
OperQualifier : {}
OperQualifierReason : N/A
OperState : unassociated
Operability : operable
OriginalUuid : 1b4e28ba-2fa1-11d2-0301-b9a761bde3fb
PartNumber :
PolicyLevel : 0
PolicyOwner : local
Presence : equipped
Revision : 0
Sacl :
ScaledMode : single
Serial : SRV107
ServerId : 3/1
SlotId : 1
StorageOperQualifier : unknown
TotalMemory : 49152
UsrLbl :
Uuid : 1b4e28ba-2fa1-11d2-0301-b9a761bde3fb
Vendor : Cisco Systems Inc
Vid :
Ucs : UCSPE-10-0-100-162
Dn : sys/chassis-3/blade-1
Rn : blade-1
Status :
XtraProperty : {}

And you can filter the result with the pipe command and Select-Object

PS C:\WINDOWS\system32> Get-UcsServer | Select-Object Dn
Dn
sys/chassis-3/blade-1
sys/chassis-3/blade-3
sys/chassis-3/blade-7
sys/chassis-3/blade-5
sys/chassis-4/blade-1
sys/chassis-4/blade-2
sys/chassis-5/blade-1
sys/chassis-5/blade-2
sys/chassis-5/blade-3
sys/chassis-6/blade-1
sys/chassis-6/blade-2
sys/chassis-6/blade-3
sys/rack-unit-1
sys/rack-unit-2
sys/rack-unit-3
sys/rack-unit-4
sys/rack-unit-5
sys/rack-unit-6
sys/rack-unit-7
sys/rack-unit-8
sys/rack-unit-9
sys/rack-unit-10
sys/rack-unit-11
sys/rack-unit-12

or with two filters to Get the Serial for each server

PS C:\WINDOWS\system32> Get-UcsServer | Select-Object Dn,Serial
Dn Serial
-- ------
sys/chassis-3/blade-1 SRV107
sys/chassis-3/blade-3 SRV108
sys/chassis-3/blade-7 SRV110
sys/chassis-3/blade-5 SRV126
sys/chassis-4/blade-1 SRV111
sys/chassis-4/blade-2 SRV112
sys/chassis-5/blade-1 SRV113
sys/chassis-5/blade-2 SRV114
sys/chassis-5/blade-3 SRV115
sys/chassis-6/blade-1 SRV122
sys/chassis-6/blade-2 SRV124
sys/chassis-6/blade-3 SRV125
sys/rack-unit-1 ND80
sys/rack-unit-2 ND81
sys/rack-unit-3 RK46
sys/rack-unit-4 RK54
sys/rack-unit-5 RK57
sys/rack-unit-6 RK58
sys/rack-unit-7 RK59
sys/rack-unit-8 RK60
sys/rack-unit-9 RK62
sys/rack-unit-10 RK63
sys/rack-unit-11 RK64
sys/rack-unit-12 RK65

You can see Servers and Blades with the previous command or only the blade.

PS C:\WINDOWS\system32> Get-UcsBlade | Select-Object Dn,Serial
Dn Serial
-- ------
sys/chassis-3/blade-1 SRV107
sys/chassis-3/blade-3 SRV108
sys/chassis-3/blade-5 SRV126
sys/chassis-3/blade-7 SRV110
sys/chassis-4/blade-1 SRV111
sys/chassis-4/blade-2 SRV112
sys/chassis-5/blade-1 SRV113
sys/chassis-5/blade-2 SRV114
sys/chassis-5/blade-3 SRV115
sys/chassis-6/blade-1 SRV122
sys/chassis-6/blade-2 SRV124
sys/chassis-6/blade-3 SRV125

You can search all commands ucs and the documentation with the following commands:

PS C:\WINDOWS\system32> Get-Command -noun Ucs | more
CommandType Name Version Source
----------- ---- ------- ------
Alias Acknowledge-UcsBlade 2.5.3.0 Cisco.UcsManager
Alias Acknowledge-UcsChassis 2.5.3.0 Cisco.UcsManager
Alias Acknowledge-UcsFault 2.5.3.0 Cisco.UcsManager
Alias Acknowledge-UcsFex 2.5.3.0 Cisco.UcsManager
Alias Acknowledge-UcsRackUnit 2.5.3.0 Cisco.UcsManager
Alias Acknowledge-UcsServerUnit 2.5.3.0 Cisco.UcsManager
Alias Acknowledge-UcsSlot 2.5.3.0 Cisco.UcsManager
Alias Add-UcsMo 2.5.3.0 Cisco.UcsManager
Alias Associate-UcsServiceProfile 2.5.3.0 Cisco.UcsManager
Alias Compare-UcsMo 2.5.3.0 Cisco.UcsManager
Alias Decommission-UcsBlade 2.5.3.0 Cisco.UcsManager
Alias Decommission-UcsChassis 2.5.3.0 Cisco.UcsManager
Alias Decommission-UcsFex 2.5.3.0 Cisco.UcsManager
Alias Decommission-UcsRackUnit 2.5.3.0 Cisco.UcsManager
Alias Decommission-UcsServerUnit 2.5.3.0 Cisco.UcsManager
Alias Disable-UcsDiskLocatorLed 2.5.3.0 Cisco.UcsManager
Alias Disassociate-UcsServiceProfile 2.5.3.0 Cisco.UcsManager
Alias Enable-UcsDiskLocatorLed 2.5.3.0 Cisco.UcsManager
Alias Get-UcsCentral 2.5.3.0 Cisco.UcsManager
Alias Get-UcsMo 2.5.3.0 Cisco.UcsManager
Alias Get-UcsOs 2.5.3.0 Cisco.Ucs.Core
[..]

PS C:\WINDOWS\system32> Get-help Get-UcsServer
NOM
Get-UcsServer
RÉSUMÉ
Gets Managed Object of type ComputeBlade, ComputeRackUnit and ComputeServerUnit.
SYNTAXE
Get-UcsServer [-Ucs ] []
DESCRIPTION
Gets Managed Object of type ComputeBlade, ComputeRackUnit and ComputeServerUnit.
LIENS CONNEXES
REMARQUES
Pour consulter les exemples, tapez : "get-help Get-UcsServer -examples".
Pour plus d'informations, tapez : "get-help Get-UcsServer -detailed".
Pour obtenir des informations techniques, tapez : "get-help Get-UcsServer -full".

Vlans

Get Vlans

PS C:\WINDOWS\system32> Get-UCsVlan | Select-Object Dn,Name,Id,SwitchId
Dn Name Id SwitchId
-- ---- -- --------
fabric/eth-estc/net-default default 1 dual
fabric/lan/A/net-default default 1 A
fabric/lan/A/net-finance finance 3 A
fabric/lan/A/net-human-resource human-resource 5 A
fabric/lan/B/net-default default 1 B
fabric/lan/B/net-finance finance 3 B
fabric/lan/B/net-human-resource human-resource 5 B
fabric/lan/net-default default 1 dual

Add Vlans

PS C:\WINDOWS\system32> Get-help Add-UcsVlan
PS C:\WINDOWS\system32> Get-UcsLanCloud | Add-UcsVlan -Name NewVlan42 -Id 42
AssocPrimaryVlanState : ok
AssocPrimaryVlanSwitchId : NONE
Cloud : ethlan
CompressionType : included
ConfigIssues :
ConfigOverlap : ok
DefaultNet : no
EpDn :
Global : 0
Id : 42
IfRole : network
IfType : virtual
Local : 0
Locale : external
McastPolicyName :
Name : NewVlan42
OperMcastPolicyName :
OperState : ok
OverlapStateForA : active
OverlapStateForB : active
PeerDn :
PolicyOwner : local
PubNwDn :
PubNwId : 1
PubNwName :
Sacl :
Sharing : none
SwitchId : dual
Transport : ether
Type : lan
Ucs : UCSPE-10-0-100-162
Dn : fabric/lan/net-NewVlan42
Rn : net-NewVlan42
Status : created
XtraProperty : {}

Verify

PS C:\WINDOWS\system32> Get-UCsVlan | Select-Object Dn,Name,Id,SwitchId
Dn Name Id SwitchId
-- ---- -- --------
fabric/eth-estc/net-default default 1 dual
fabric/lan/A/net-default default 1 A
fabric/lan/A/net-finance finance 3 A
fabric/lan/A/net-human-resource human-resource 5 A
fabric/lan/B/net-default default 1 B
fabric/lan/B/net-finance finance 3 B
fabric/lan/B/net-human-resource human-resource 5 B
fabric/lan/net-default default 1 dual
fabric/lan/net-NewVlan42 NewVlan42 42 dual

In addition to Powershell, you can also use the python SDK (Docs).

Example to add a new vlan:

from ucsmsdk.ucshandle import UcsHandle
from ucsmsdk.mometa.fabric.FabricVlan import FabricVlan
Create a connection handle
handle = UcsHandle("10.0.100.162", "ucspe", "ucspe")
Login to the server
handle.login()
fabric_lan_dn = handle.query_dn("fabric/lan")
newvlan = FabricVlan(parent_mo_or_dn=fabric_lan_dn,
name = "vlan10",
id="10")
handle.add_mo(newvlan)
handle.commit()
Logout from the server
handle.logout()

Service Profile

PS C:\WINDOWS\system32> Get-UcsServiceProfile
AgentPolicyName :
AssignState : unassigned
AssocState : unassociated
BiosProfileName :
BootPolicyName :
ConfigQualifier : {}
ConfigState : not-applied
Descr :
DynamicConPolicyName :
ExtIPPoolName : ext-mgmt
ExtIPState : none
GraphicsCardPolicyName :
HostFwPolicyName :
IdentPoolName :
KvmMgmtPolicyName :
LocalDiskPolicyName :
MaintPolicyName :
MgmtAccessPolicyName :
MgmtFwPolicyName :
Name : ServiceProfile1
OperBiosProfileName :
OperBootPolicyName : org-root/boot-policy-default
OperDynamicConPolicyName :
OperExtIPPoolName :
OperGraphicsCardPolicyName : org-root/graphics-card-policy-default
OperHostFwPolicyName : org-root/fw-host-pack-default
OperIdentPoolName :
OperKvmMgmtPolicyName : org-root/kvm-mgmt-policy-default
OperLocalDiskPolicyName : org-root/local-disk-config-default
OperMaintPolicyName : org-root/maint-default
OperMgmtAccessPolicyName :
OperMgmtFwPolicyName :
OperPersistentMemoryPolicyName :
OperPowerPolicyName : org-root/power-policy-default
OperPowerSyncPolicyName : org-root/power-sync-default
OperScrubPolicyName : org-root/scrub-default
OperSolPolicyName :
OperSrcTemplName :
OperState : unassociated
OperStatsPolicyName : org-root/thr-policy-default
OperVconProfileName :
OperVmediaPolicyName :
Owner : management
PersistentMemoryPolicyName :
PnDn :
PolicyLevel : 0
PolicyOwner : local
PowerPolicyName : default
PowerSyncPolicyName :
PropAcl : 0
ResolveRemote : yes
Sacl :
ScrubPolicyName :
SolPolicyName :
SrcTemplName :
StatsPolicyName : default
SvnicConfig : yes
Type : instance
UsrLbl :
Uuid : derived
UuidSuffix : 0000-000000000000
VconProfileName :
VmediaPolicyName :
Ucs : UCSPE-10-0-100-162
Dn : org-root/ls-ServiceProfile1
Rn : ls-ServiceProfile1
Status :
XtraProperty : {}

A lot of examples can be found here : https://github.com/CiscoUcs

How to Stream Telemetry with Grafana and Cisco Nexus

Usually, SNMP is used to pool network devices. SNMP especially the walk function is very CPU intensive and is often unsecured by using SNMPv1 or SNMPv2.

Telemetry can help you to monitor your devices and not only the CPU/Memory or interface (in/out) counter. You can also monitor CRC, Optic budget, etc easily.

We will use Grafana with InfluxDB and Telegraf.

On Cisco Nexus device you need to enable the feature telemetry.

feature telemetry

Then you need to configure three others parts:

  • A destination group, where is located your NMS tool
  • A sensor Group, which contains what you want to stream to your NMS tool
  • A subscription, which associates the destination group and the sensor group.
telemetry
  destination-group 1
    ip address 10.202.2.100 port 57000 protocol gRPC encoding GPB
    use-vrf management
  sensor-group 101
    data-source NX-API
    path "show system resources" depth 0
  sensor-group 102
    data-source NX-API
    path "show interface transceiver detail"
  sensor-group 103
    data-source NX-API
    path "show interface"
    path "show interface e1/2"
  subscription 101
    dst-grp 1
    snsr-grp 101 sample-interval 10000
  subscription 102
    dst-grp 1
    snsr-grp 102 sample-interval 60000
  subscription 103
    dst-grp 1
    snsr-grp 103 sample-interval 10000

In the previous example, we can see one destination group to stream the data to the server 10.202.2.100 port 57000/tcp. We use gRPC with GPB to send the flow.

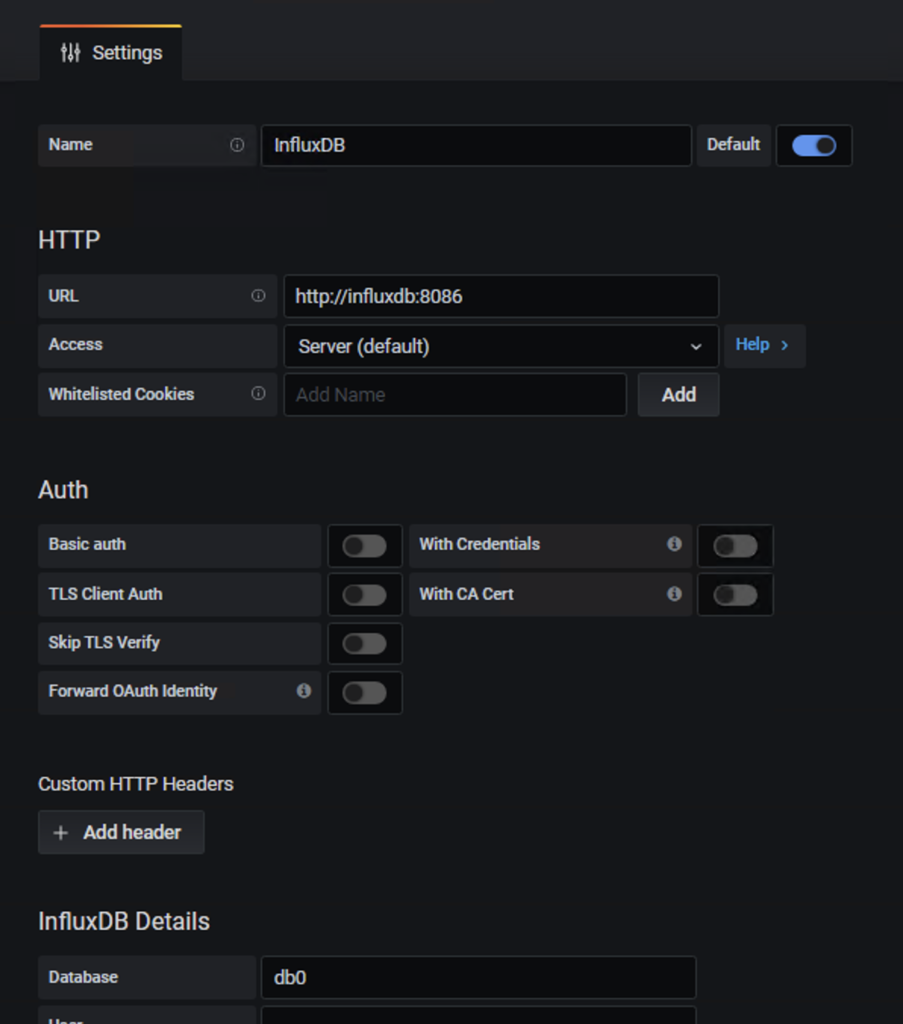
The server 10.202.2.100 is a docker server, which runs Grafana with influxDB and telegraf.

# docker ps
CONTAINER ID        IMAGE                                   COMMAND                  CREATED             STATUS              PORTS                                                    NAMES
0ea44fcb6359        telegraf                                "/entrypoint.sh tele…"   5 days ago          Up 5 days           8092/udp, 8125/udp, 8094/tcp, 0.0.0.0:57000->57000/tcp   telemetry_telegraf_1
37001630a9aa        grafana/grafana:latest                  "/run.sh"                5 days ago          Up 5 days           0.0.0.0:3000->3000/tcp                                   telemetry_grafana_1
db99097a276f        influxdb:latest                         "/entrypoint.sh infl…"   5 days ago          Up 5 days           0.0.0.0:8086->8086/tcp                                   telemetry_influxdb_1

You can run this stack with the following docker-compose file.

To start the stack enters the command docker-compose up -d

# cat docker-compose.yml
version: '3'
services:
  grafana:
    #restart: always
    image: grafana/grafana:latest
    ports:
     - "3000:3000"
    tty: true
    privileged: true
  influxdb:
    image: influxdb:latest
    ports:
      - '8086:8086'
    environment:
      - INFLUXDB_DB=db0
  telegraf:
    image: telegraf
    ports:
      - '57000:57000'
    #restart: always

On the telegraf configuration, we just specify where is the influx database and what we used to receive the flow from the Nexus devices.

[global_tags]

[agent]
  interval = "10s"
  round_interval = true
  metric_batch_size = 1000
  metric_buffer_limit = 10000
  collection_jitter = "0s"

  flush_interval = "10s"
  flush_jitter = "0s"

  precision = ""

  hostname = ""
  omit_hostname = false

[..]

[[outputs.influxdb]]
  urls = ["http://influxdb:8086"]
  database = "db0"

[[inputs.cisco_telemetry_mdt]]
transport = "grpc"
service_address = ":57000"
 [inputs.cisco_telemetry_mdt.aliases]
    ifstats = "ietf-interfaces:interfaces-state/interface/statistics"

The data source on Grafana:

Now, you should received data to your influxdb via your pipeline telegraf. This is the moment to create a dashboard.

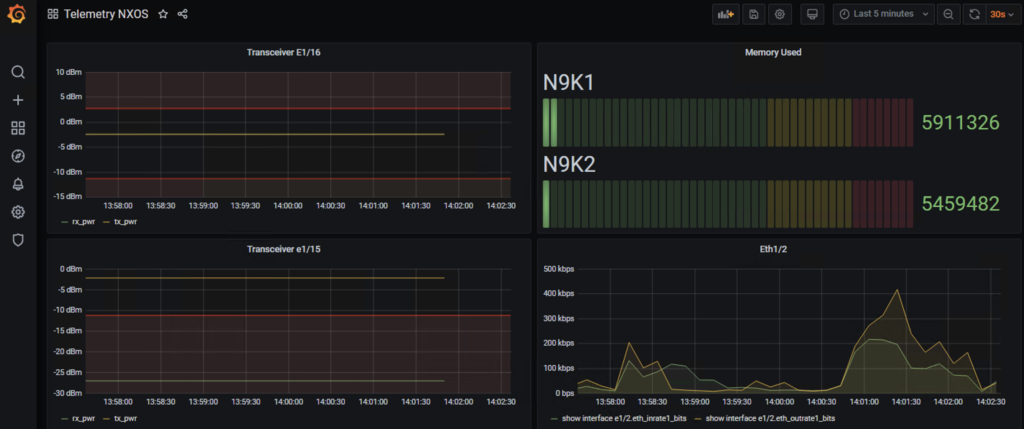
The following example will show how to monitor your optical budget.
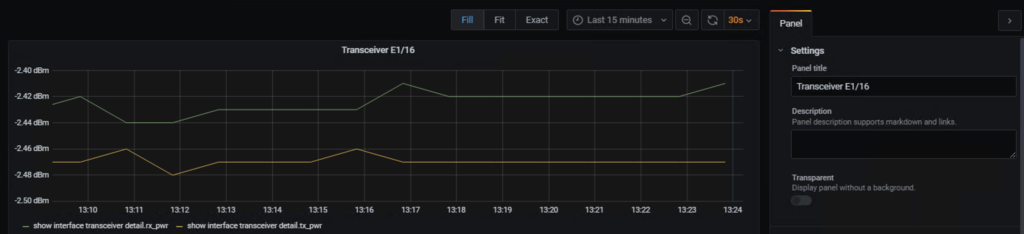
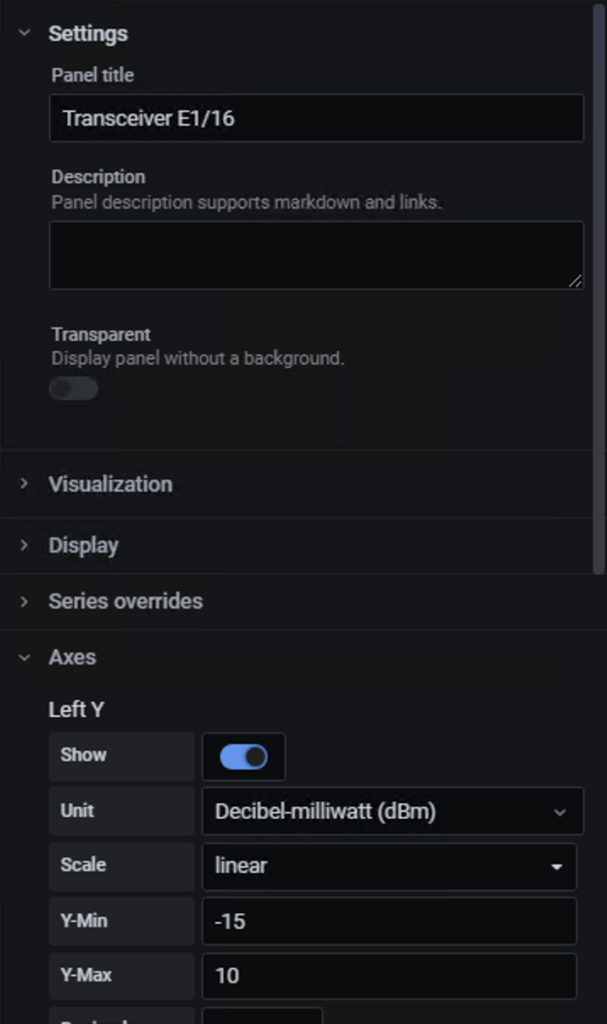
Grafana example

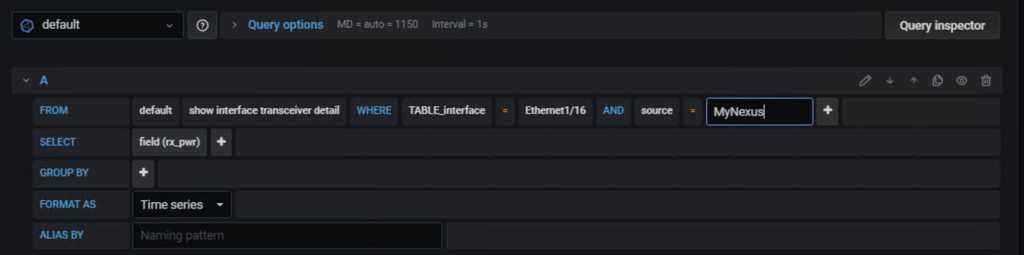
Now you need to create you request to get the value. In this example we want to use the stream with the command “show interface transceiver detail” and select one specific interface (Ethernet 1/16). We can use the parameter Where Table_interface to get all interfaces and select the good one. Finally if you have a lot of Nexus devices you can add a source. The latest part is to select which value you want. Here we get rx_pwr.

Grafana request

If you need to have the detail before. You can enter the following command on your Cisco Nexus device.

# show interface e1/16 transceiver details | json-pretty
{
    "TABLE_interface": {
        "ROW_interface": {
            "interface": "Ethernet1/16",
            "sfp": "present",
            "type": "Fabric Extender Transceiver",
            "name": "CISCO-FINISAR",
            "partnum": "FTLX8570D3BCL-C2",
            "rev": "A",
            "serialnum": "FNxxxxxxx",
            "nom_bitrate": "10300",
            "len_625": "10",
            "len_50_OM3": "100",
            "ciscoid": "3",
            "ciscoid_1": "4",
            "cisco_part_number": "10-2566-02",
            "cisco_product_id": "FET-10G",
            "cisco_vendor_id": "V02",
            "TABLE_lane": {
                "ROW_lane": {
                    "temperature": "36.36",
                    "temp_flag": null,
                    "temp_alrm_hi": "75.00",
                    "temp_alrm_lo": "5.00",
                    "temp_warn_hi": "70.00",
                    "temp_warn_lo": "10.00",
                    "voltage": "3.26",
                    "volt_flag": null,
                    "volt_alrm_hi": "3.63",
                    "volt_alrm_lo": "2.97",
                    "volt_warn_hi": "3.46",
                    "volt_warn_lo": "3.13",
                    "current": "7.89",
                    "current_flag": null,
                    "current_alrm_hi": "11.80",
                    "current_alrm_lo": "4.00",
                    "current_warn_hi": "10.80",
                    "current_warn_lo": "5.00",
                    "tx_pwr": "-2.47",
                    "tx_pwr_flag": null,
                    "tx_pwr_alrm_hi": "2.69",
                    "tx_pwr_alrm_lo": "-11.30",
                    "tx_pwr_warn_hi": "-1.30",
                    "tx_pwr_warn_lo": "-7.30",
                    "rx_pwr": "-2.42",
                    "rx_pwr_flag": null,
                    "rx_pwr_alrm_hi": "2.99",
                    "rx_pwr_alrm_lo": "-13.97",
                    "rx_pwr_warn_hi": "-1.00",
                    "rx_pwr_warn_lo": "-9.91",
                    "xmit_faults": "0"
                }
            }
        }
    }
}

You can change the title and the units.

You can also define thresholds.

Grafana Threshold

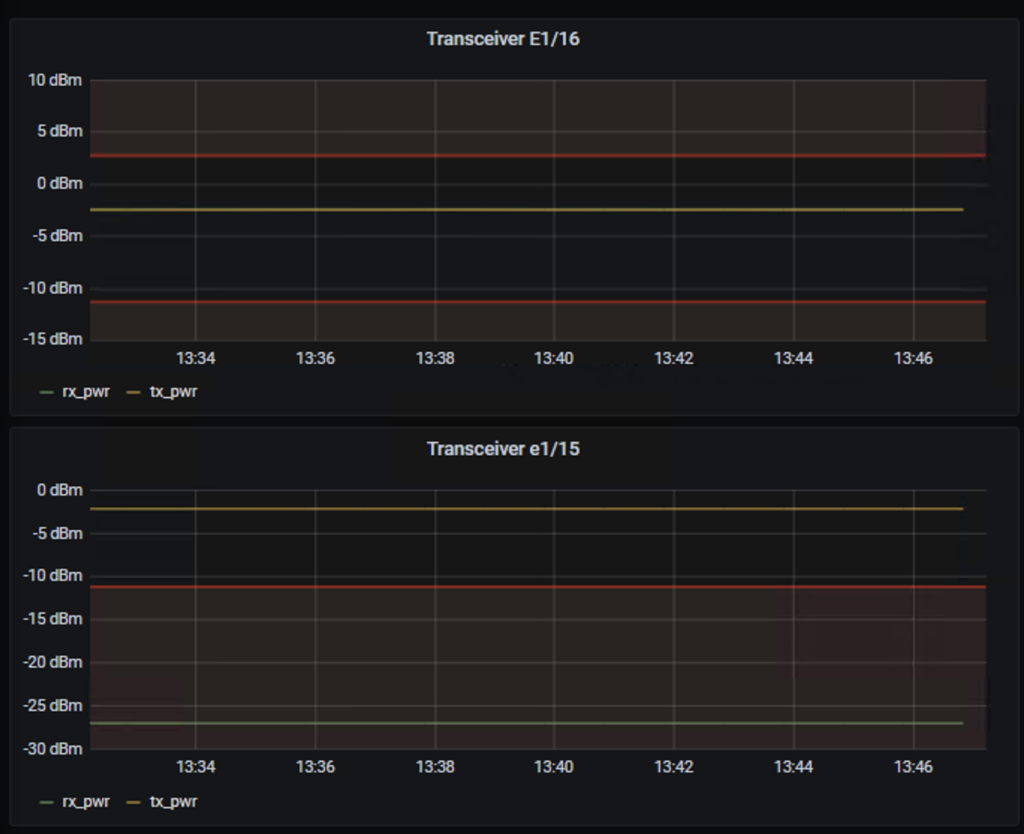
The following picture will show you two cases. The Ethernet E1/15 which has an issue in Rx and the Ethernet E1/16 where the values are good.

In CLI :

N9K1# show interface e1/15 transceiver details
Ethernet1/15
    transceiver is present
    type is Fabric Extender Transceiver
    name is CISCO-JDSU
    part number is PLRXPL-VC-S43-CG
    revision is B
    serial number is JURxxxxxxxx
    nominal bitrate is 10300 MBit/sec
    Link length supported for 62.5/125um fiber is 10 m
    Link length supported for 50/125um OM3 fiber is 100 m
    cisco id is 3
    cisco extended id number is 4
    cisco part number is 10-2566-02
    cisco product id is FET-10G
    cisco version id is V02

           SFP Detail Diagnostics Information (internal calibration)
  ----------------------------------------------------------------------------
                Current              Alarms                  Warnings
                Measurement     High        Low         High          Low
  ----------------------------------------------------------------------------
  Temperature   37.33 C        75.00 C      5.00 C     70.00 C       10.00 C
  Voltage        3.26 V         3.63 V      2.97 V      3.46 V        3.13 V
  Current        4.80 mA       10.00 mA     2.59 mA     8.50 mA       3.00 mA
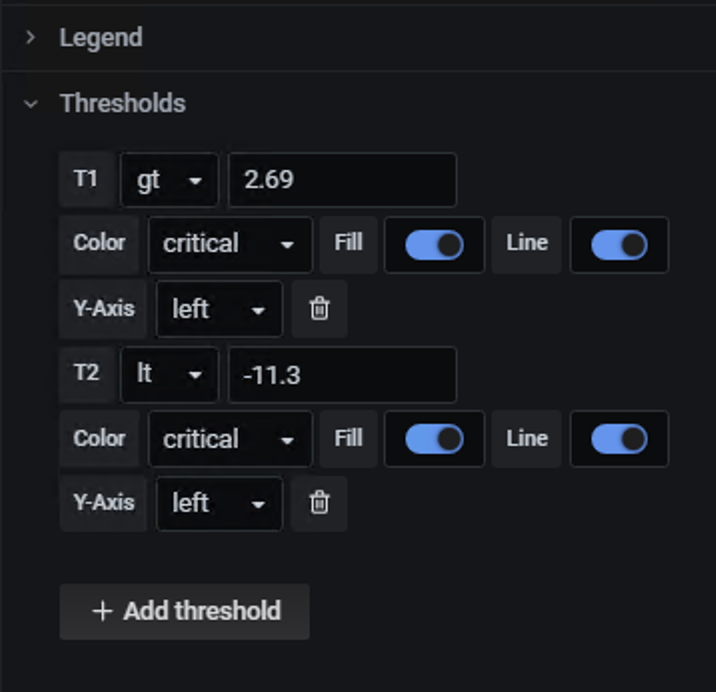
  Tx Power      -2.21 dBm       2.69 dBm  -11.30 dBm   -1.30 dBm     -7.30 dBm
  Rx Power     -26.98 dBm --    2.99 dBm  -13.97 dBm   -1.00 dBm     -9.91 dBm
  Transmit Fault Count = 0
  ----------------------------------------------------------------------------
  Note: ++  high-alarm; +  high-warning; --  low-alarm; -  low-warning

N9K1# show interface e1/16 transceiver details
Ethernet1/16
    transceiver is present
    type is Fabric Extender Transceiver
    name is CISCO-FINISAR
    part number is FTLX8570D3BCL-C2
    revision is A
    serial number is FNxxxxxxYS
    nominal bitrate is 10300 MBit/sec
    Link length supported for 62.5/125um fiber is 10 m
    Link length supported for 50/125um OM3 fiber is 100 m
    cisco id is 3
    cisco extended id number is 4
    cisco part number is 10-2566-02
    cisco product id is FET-10G
    cisco version id is V02

           SFP Detail Diagnostics Information (internal calibration)
  ----------------------------------------------------------------------------
                Current              Alarms                  Warnings
                Measurement     High        Low         High          Low
  ----------------------------------------------------------------------------
  Temperature   36.03 C        75.00 C      5.00 C     70.00 C       10.00 C
  Voltage        3.27 V         3.63 V      2.97 V      3.46 V        3.13 V
  Current        7.89 mA       11.80 mA     4.00 mA    10.80 mA       5.00 mA
  Tx Power      -2.44 dBm       2.69 dBm  -11.30 dBm   -1.30 dBm     -7.30 dBm
  Rx Power      -2.41 dBm       2.99 dBm  -13.97 dBm   -1.00 dBm     -9.91 dBm
  Transmit Fault Count = 0
  ----------------------------------------------------------------------------
  Note: ++  high-alarm; +  high-warning; --  low-alarm; -  low-warning

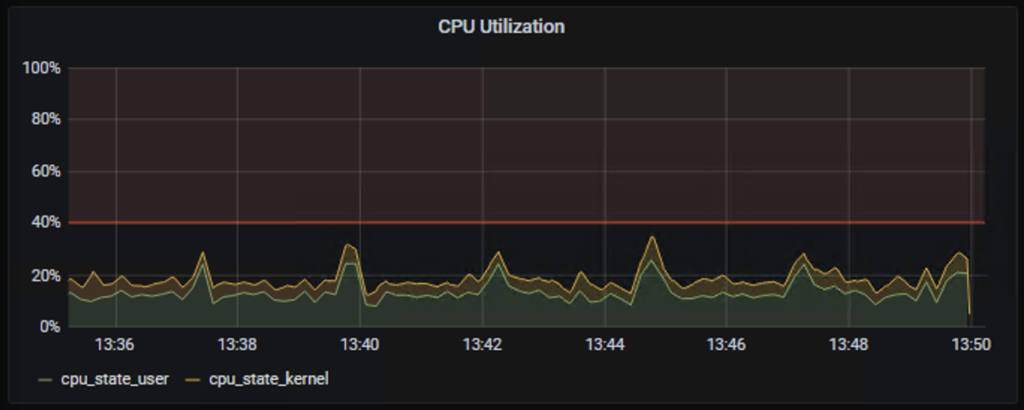
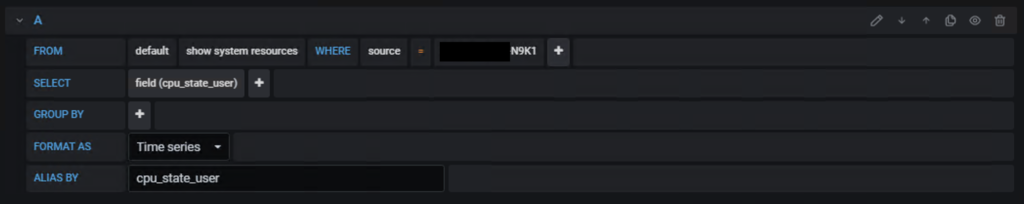
Other example to monitor the CPU with the sensor group: show system resources.